Measuring Entrepreneurial Density: A Window into Startup Ecosystems

If you want to know how entrepreneurial a place is, don’t look at how many coworking spaces are downtown or how many pitch competitions get hosted. Instead, listen. Walk down the street and count how many entrepreneurs you hear talking about their startup.
That’s the measure of “density” that Brad Feld, founder of TechStars, describes: “The number of entrepreneurs you hear pitching as you cross the street.” It’s an anecdotal way to capture the energy of new venture creation (NVC), but we can actually quantify it with data.
What is Density, and Why Does It Matter?
At Venture Asheville, we track density using a formula from the Kauffman Foundation. It’s simple: the number of new ventures created per 1,000 adults. That score tells us how many businesses are being started relative to the population—a metric that reveals how entrepreneurial a community really is.
We track Buncombe County’s density over time, and here’s what the numbers show:
- 2009 – 10.40
- 2014 – 7.47
- 2020 – 17.21
- 2021 – 17.81
- 2024 – 15.79
These numbers give us insight into economic conditions, entrepreneurial confidence, and local business support infrastructure.
What Can We Learn from These Numbers?
- A Higher Density Score = A More Entrepreneurial Population
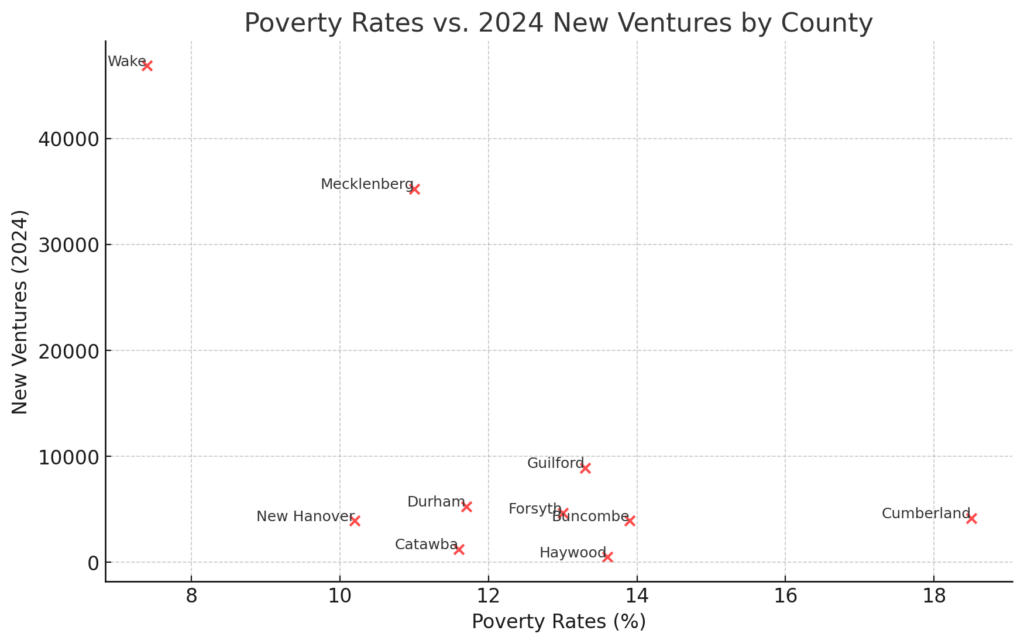
More businesses per capita means more people taking the leap into entrepreneurship. - High Density Correlates with Lower Poverty Rates
Communities with more startups tend to see stronger economic mobility. More small businesses create jobs, and more jobs lead to higher incomes and financial independence. - Entrepreneurship Booms During Economic Uncertainty
If you look at the spikes—especially in 2020-2021—you’ll notice they align with economic turbulence. This reinforces the age-old adage: Turbulence breeds opportunity. When traditional jobs become unstable, many turn to entrepreneurship out of necessity. These are what we call “Necessity-Driven Entrepreneurs”—people who start businesses because they have to, not because they want to.
Interestingly, we see an inverse correlation between overall economic health and startup creation. When times are tough, entrepreneurship surges. When stability returns, startup rates tend to slow down.

Benchmarking Against Other Communities
Tracking density doesn’t just give us insight into our own ecosystem—it lets us compare Buncombe County’s entrepreneurship levels with other regions. The following chart visualizes how NVC rates changed from 2020 to 2021, providing a benchmark for other entrepreneurial communities.

What’s Next?
For those who want to explore the numbers themselves, we’ve updated our dataset with 2024’s NVC rates (Sheet 3, Column J). The trends are fascinating, and we’d love to hear your take on what they mean.
Entrepreneurial density isn’t just a number—it’s a reflection of the risk-takers, problem-solvers, and dream-chasers shaping our communities. Whether you’re a founder, investor, or ecosystem builder, understanding density can help you predict where the next wave of innovation is coming from.
Let’s keep the conversation going. What trends are you seeing in your city? Does density reflect what you’ve observed in your entrepreneurial circles? Drop a comment or reach out—we’d love to compare notes.
